
Topics
- High-Throughput Sequencing (HTS) technologies
- Generations of sequencing technologies
- The sequencing-by-synthesis approach
- Typical data analysis workflow
Learning Objectives
By the end of this activity, you should be able to:
- Describe the principles of the “sequencing-by-synthesis” process
- Describe genomic sequencing using Illumina technology
- Outline the main features that distinguish first-, second- (“Next Generation Sequencing”), and third-generation sequencing technologies
- Describe the scope of mapping sequencing reads to the reference genome
- Explain why the use of paired-end sequencing for miRNA sequencing represents a poor experimental choice
- Explain how Phred scores reflect the quality of a sequencing read
- List at least three common applications of high-throughput sequencing in biomedical research
High-Throughput Sequencing (HTS) technologies a historical overview
👉 “You are here”
👉 The turning point: where everything changed
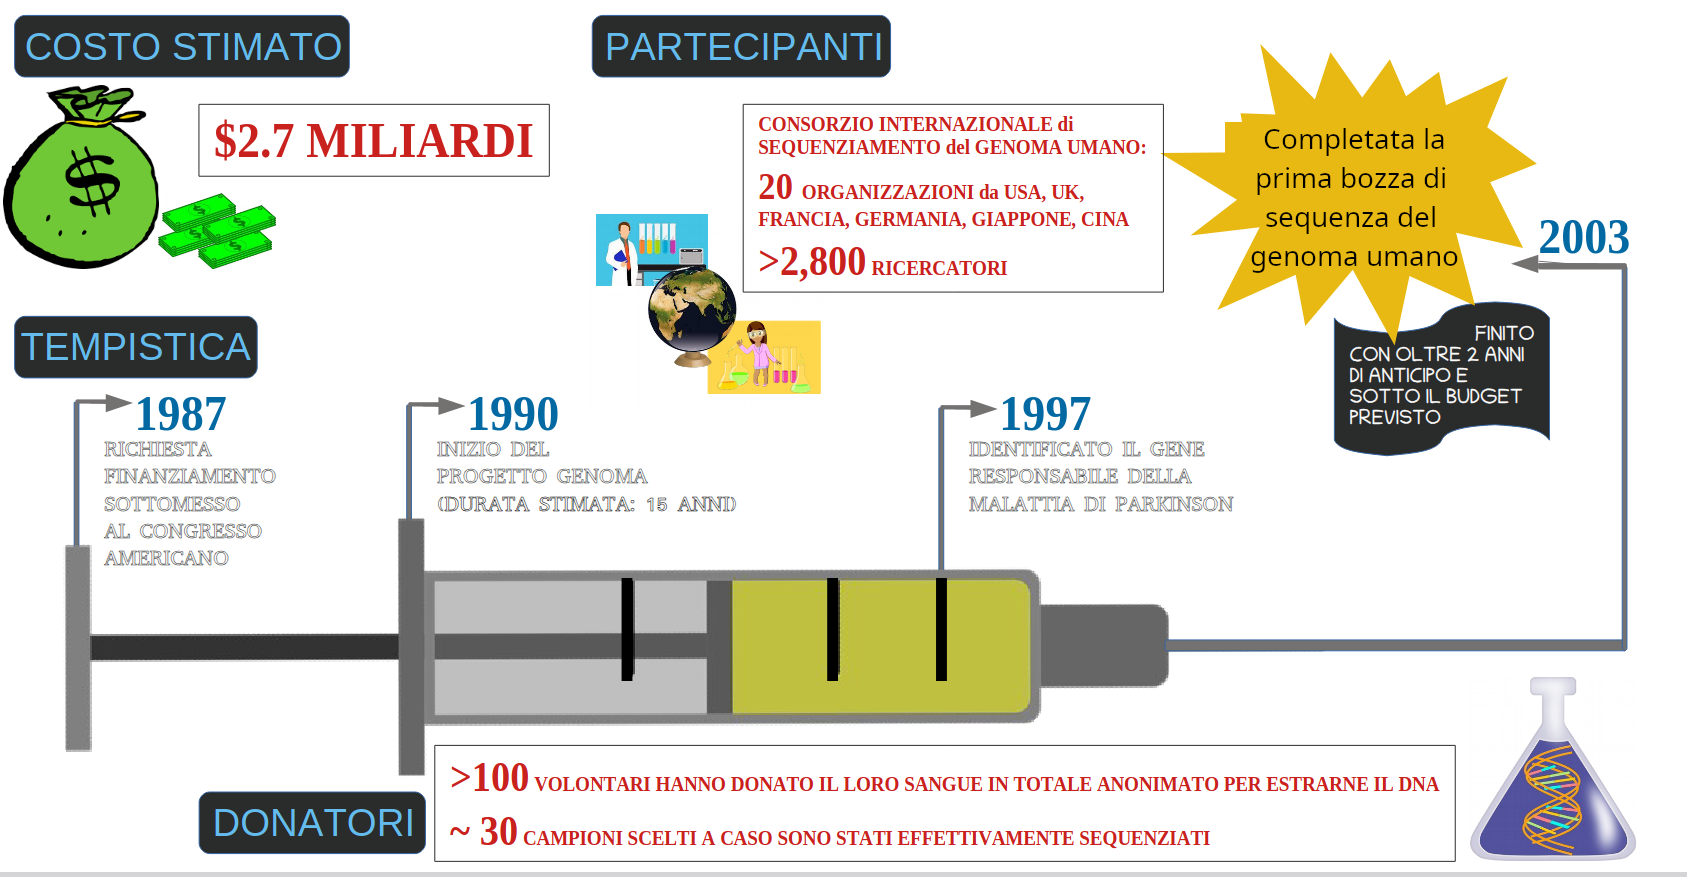
The Human Genome Project (HPG): 1990-2003

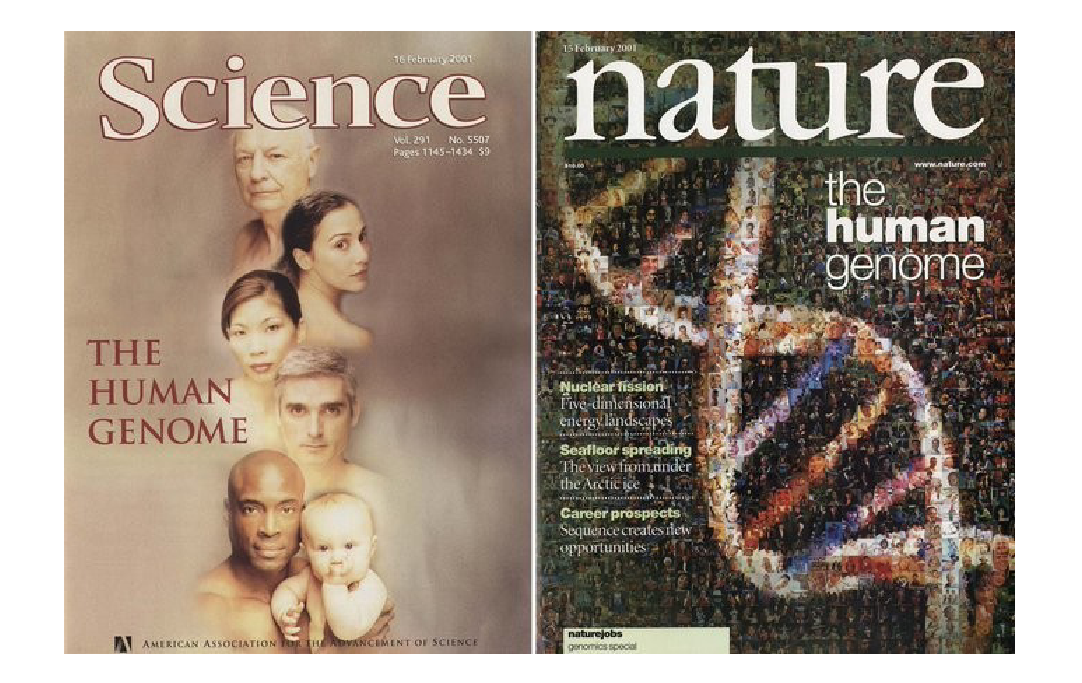
- The White House announcement of the first draft of the human genome
- A narrative history of the HGP (video in italiano intitolato “Storia di una rivoluzione: sequenza del genoma svelata”
❓ A question for you: What fraction of the human genome was considered “junk DNA” until about 20 years ago?
- ~10%
- ~50%
- ~100%
❓ Challenge question: How many genes are currently annotated in the human genome? How many transcripts? Is the total number of transcripts less than, greater than, or equal to the number of genes? Why?
Hint: To answer these questions, visit the GENCODE website (just Google it), go to the Human section, and check the Statistics page.
Further points for reflection:
- The importance of noting and recording the version of any resource queried (Which version of the GENCODE database do the statistics refer to?).
- The sequence data in the major global repositories (GenBank at NCBI, ENA – European Nucleotide Archive, DDBJ – DNA Data Bank of Japan) are daily synchronized. (What is the current version of the human genome assembly listed in the NCBI Genome database?; Does it matches the genome assembly listed for human on the EMBL-EBI Ensembl database?)
- Gene annotations curated by each major repository (e.g., NCBI, EMBL-EBI) may differ due to differences in bioinformatic prediction pipelines and the stringency applied to annotations supported by experimental evidence (e.g., RefSeq vs. GenBank; Vega vs. Ensembl). (Do the EMBL‑EBI Vega database and the NCBI RefSeq list the same number of annotated human genes?; Do these counts match the GENCODE annotated genes?)
👉 The omics revolution: a flood of sequencing data
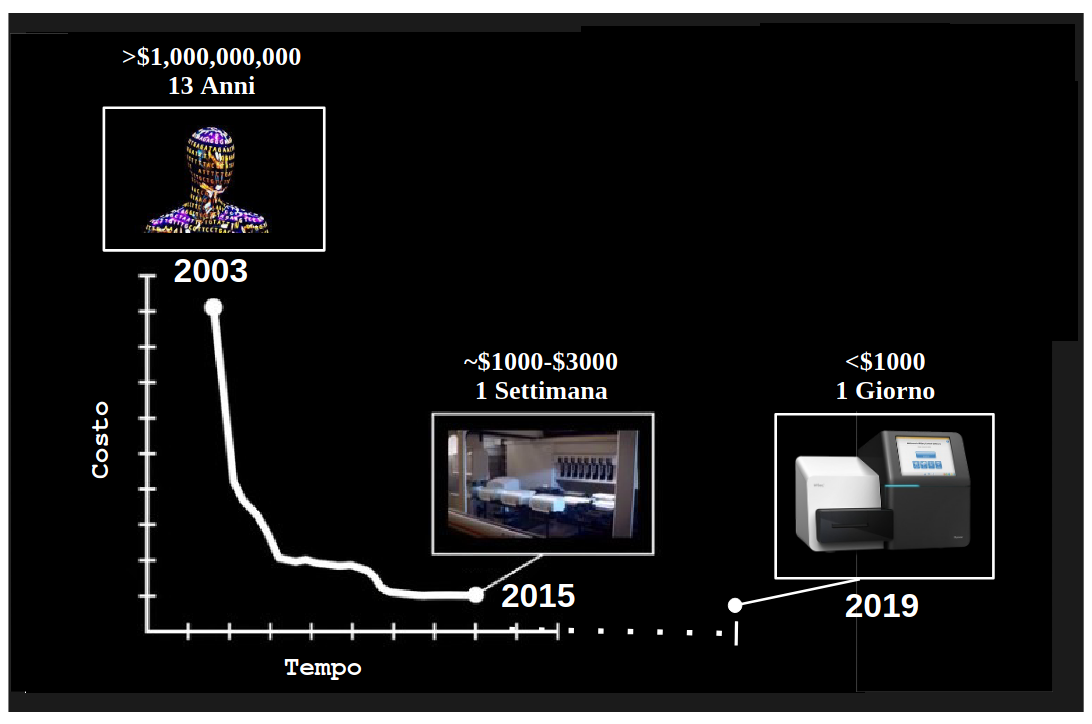
👉 NGS technologies driving the flood of sequencing data
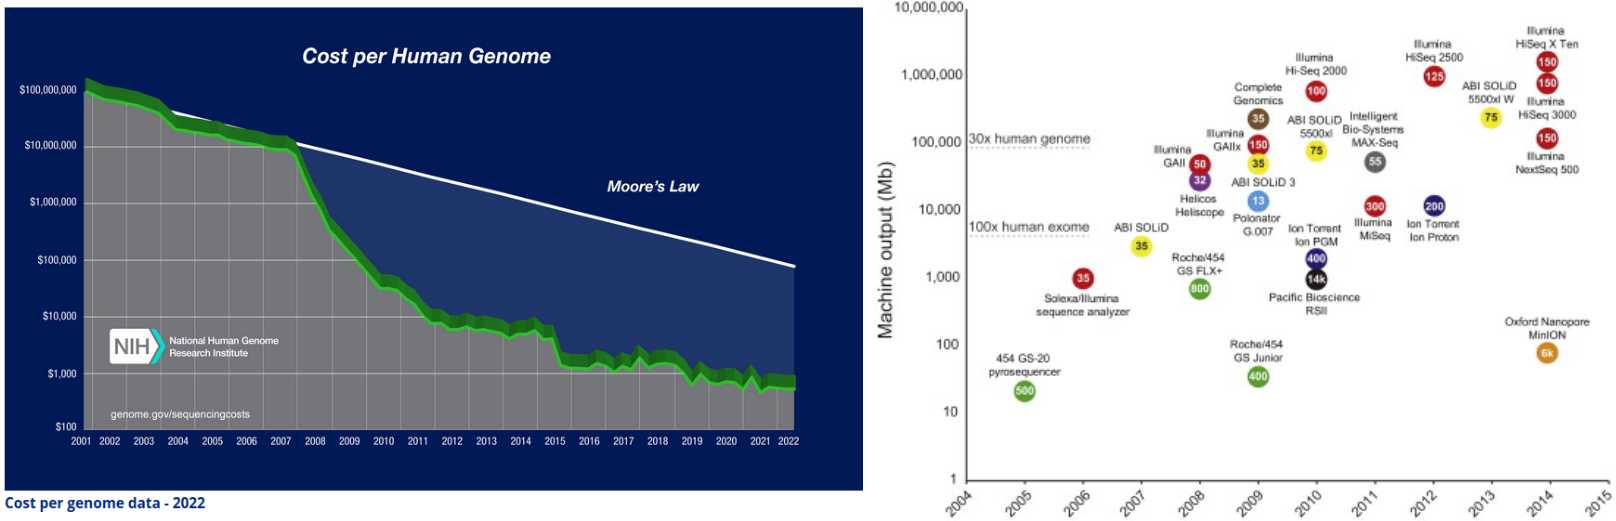
Image credits.(Left) NIH-NHGRI - The Cost of Sequencing a Human Genome; (right) Mol Cell. 2015 May 21
Check Hayden, E. Technology: The $1,000 genome. Nature 507, 294–295 (2014). https://doi.org/10.1038/507294a
At the following link, table 1 lists the different generations of sequencing technologies, along with their key characteristics.
👉 Take-Home Message (so far):
- In the aftermath of the Human Genome Project, a major push toward the development of high-throughput sequencing technologies - driven largely by U.S. government funding initiatives such as the $1,000 Genome Project - led to a dramatic reduction in sequencing costs and an exponential growth in omics data available to the scientific community.
- Sequencing the human genome led to a reassessment of the number of protein-coding genes and, for the first time, revealed the existence of tens of thousands of non-protein-coding genes.
- The sequencing data produced served as the foundation for databases that collect and organize this information. In the world of biomedical databases, two primary portals stand out: the NIH-NCBI (USA) and the EMBL-EBI (EU). Each hosts multiple databases dedicated to primary genome sequences and covers all types of annotations, including genes, proteins, regulatory sequences, clinical variants, disease associations, and experimental data contributed by individual researchers and large consortia. These portals also provide supporting resources, such as analytical tools and extensive documentation (more on this in the next lessons).
Generations of sequencing technologies
👉 The first generation:
Walter Gilbert and Frederick Sanger shared the 1980 Nobel Prize in Chemistry for developing the first-generation DNA sequencing methods.
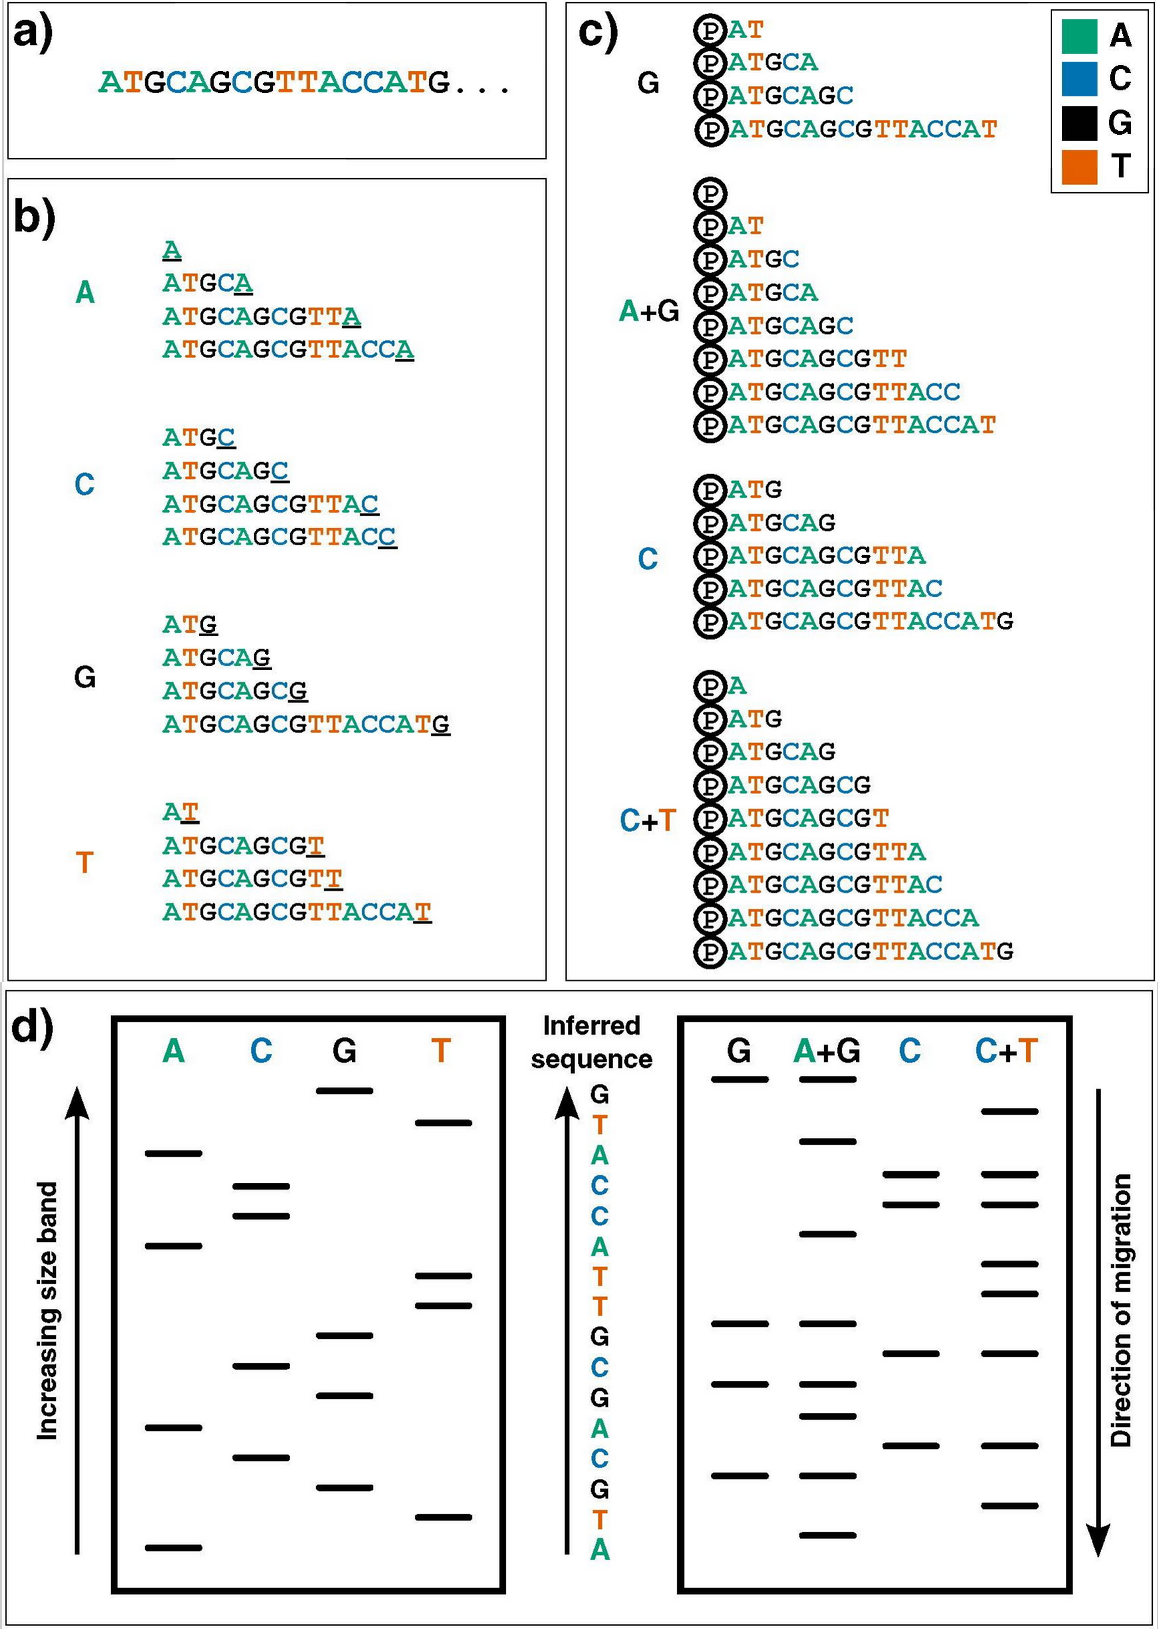 Image credits. Genomics. 2016 Jan;107(1):1–8.. First-generation DNA sequencing technologies. Example DNA to be sequenced (a) is illustrated undergoing either Sanger (b) or Maxam–Gilbert (c) sequencing. (d): Fragments generated from either methodology can then be visualized via electrophoresis on a high-resolution polyacrylamide gel: sequences are then inferred by reading ‘up’ the gel, as the shorter DNA fragments migrate fastest.
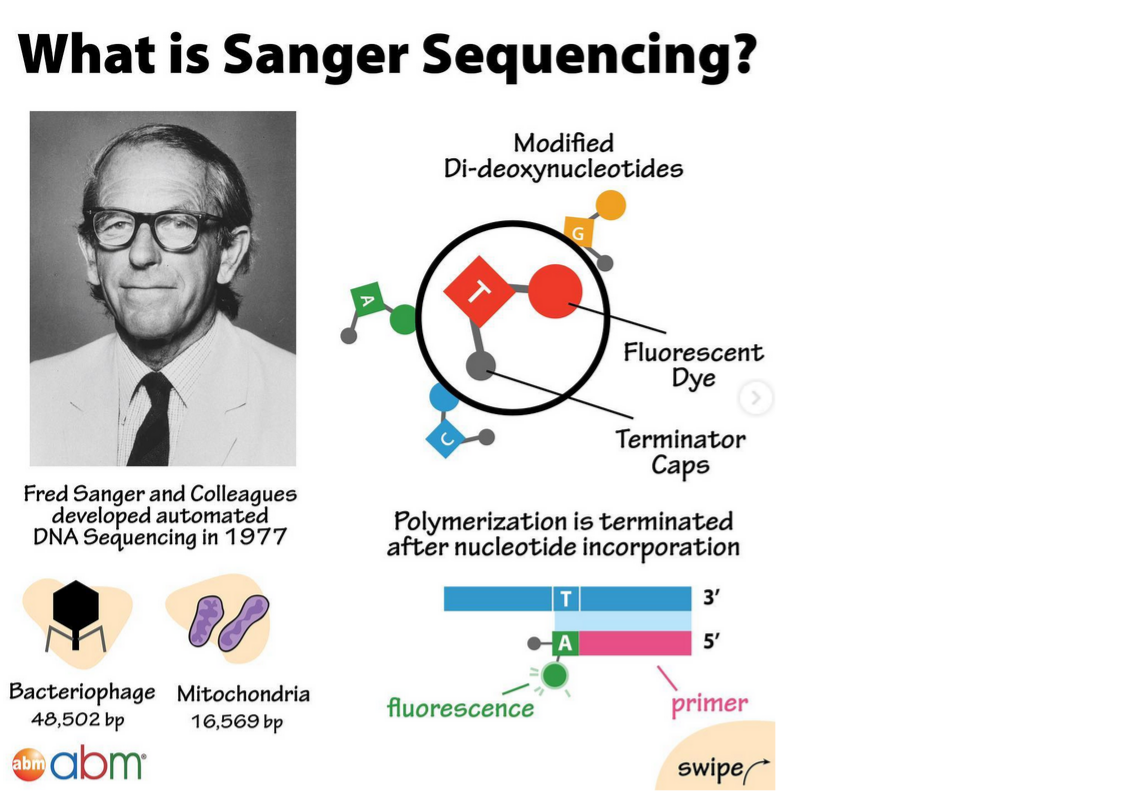 Image credits.
Sanger sequencing:
How does it work? 🤔It uses a high fidelity DNA-dependent polymerase to generate a complementary copy to a single stranded DNA template.
1️⃣ In each reaction a single primer, complementary to the template, initiates a DNA synthesis reaction from its 3’ end.
2️⃣ A, G, T and C di-deoxynucleotides are added in a template-dependent manner one after the other. These di-deoxynucleotides are modified so that they terminate polymerization when incorporated and also fluoresce to allow detection.
3️⃣ After each reaction, many copies of different-length DNA fragments are generated that are terminated at all of the nucleotide positions of the template molecule by one of the di-deoxynucleotides.
4️⃣The reaction mixtures are loaded on the sequencing machine, either manually onto slab gels or automatically with capillaries, and are electrophoresed to separate the DNA molecules by size.
5️⃣The DNA sequence is read through the fluorescent emission of the di-deoxynucleotide as it flows through the gel.
Fun fact:: With Sanger sequencing, a single reaction could read only about 400 bases per week, which made sequencing even a small genome like baker’s yeast a months‑long task!
❓ A question for you: How big is the baker’s yeast (Saccharomyces cerevisiae) genome?
Hint: try to find your answer by querying the NIH-NCBI Genome database. To do so:
- Open a browser and go to the NIH-NCBI data portal: https://www.ncbi.nlm.nih.gov
- Select the Genome database from the drop-down menu on the left side of the search box
- Enter a relevant keyword to access the baker’s yeast (Saccharomyces cerevisiae) genome
- Click the search button.
❓ A question for you: What happens if you place a DNA molecule in an electric field, what will it do, and why?
- nothing
- migrate towards the negative pole
- migrate towards the positive pole
👉 The second (next) generation:
</div>
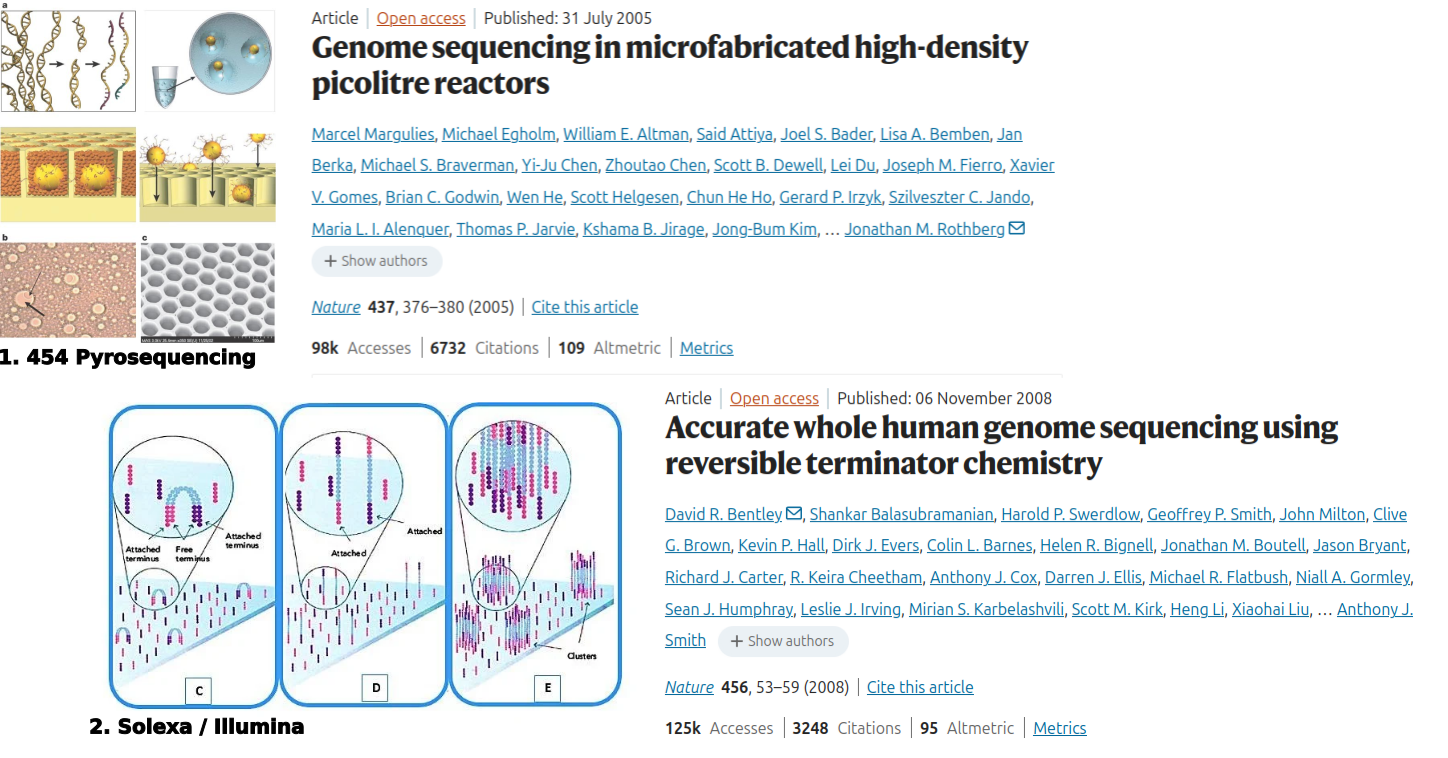
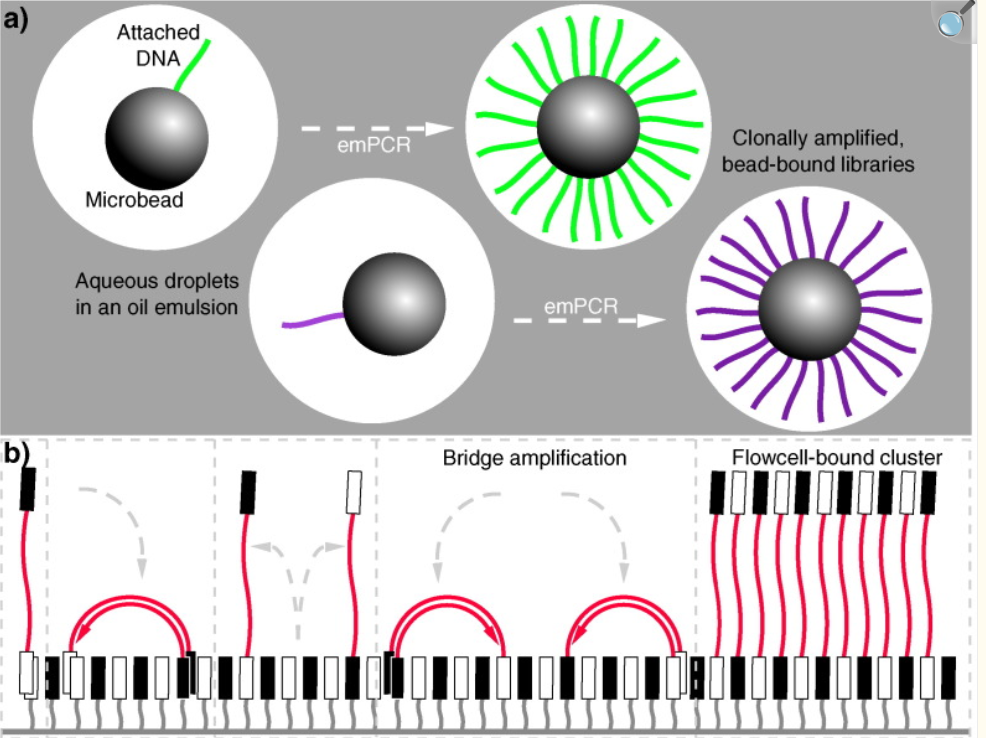
Image credits. Genomics. 2016 Jan;107(1):1–8.. Next-generation DNA sequencing parallelized amplification.(a) 454 sequencing: clonal amplification on beads (emulsion PCR); (b) Illumina/Solexa sequencing: bridge amplification on a flow cell.
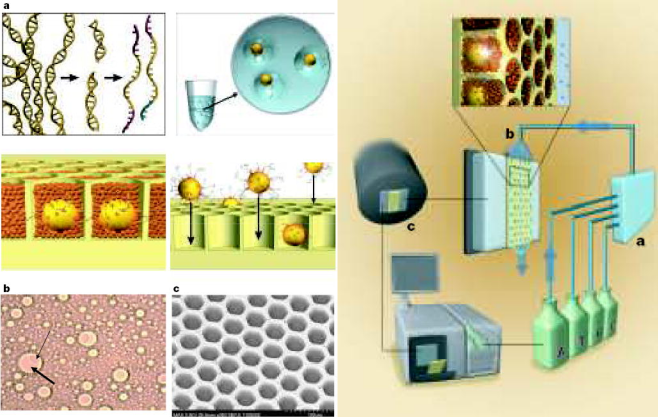
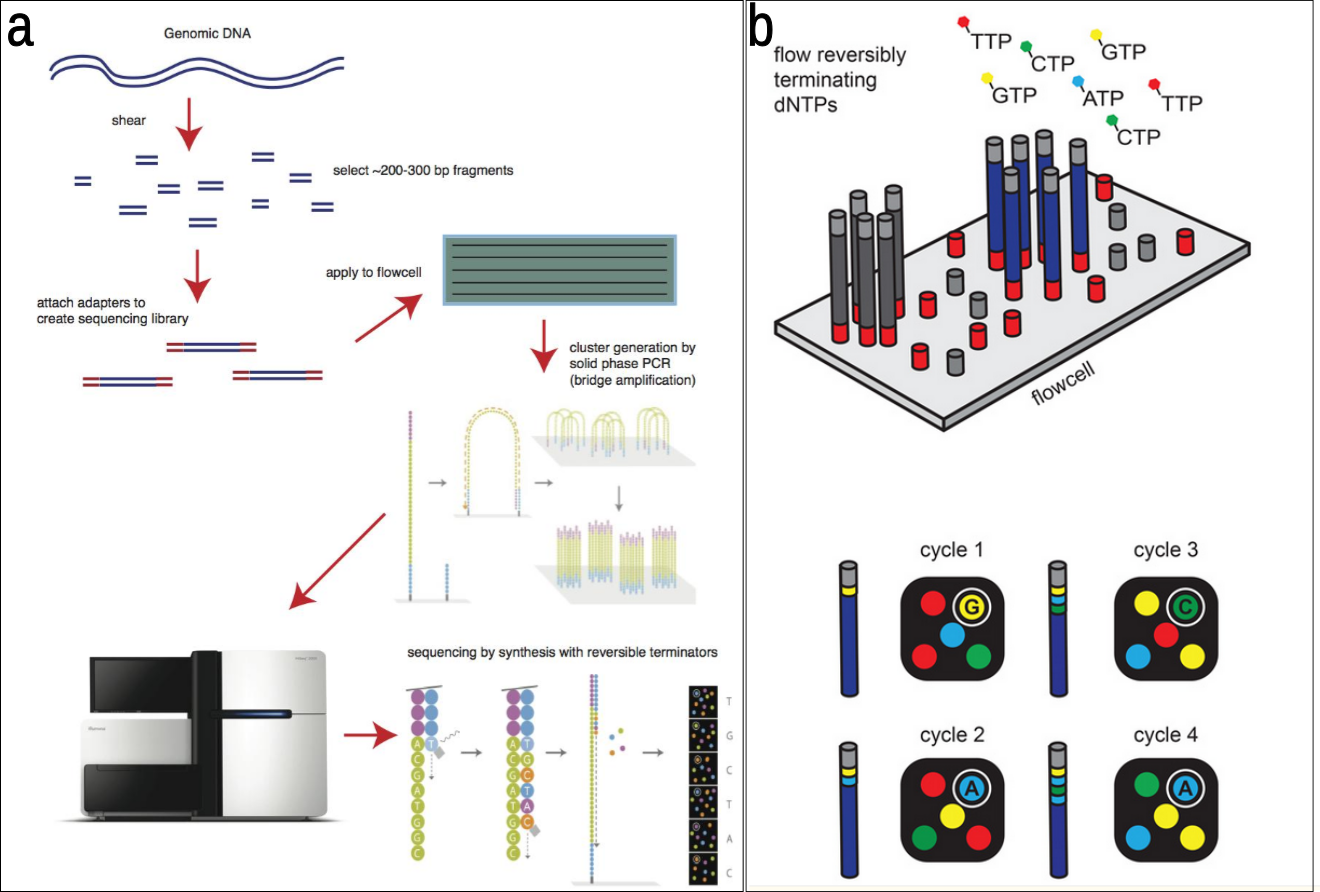
Image credits. Genomics. 2016 Jan;107(1):1–8.. First-generation DNA sequencing technologies. Example DNA to be sequenced (a) is illustrated undergoing either Sanger (b) or Maxam–Gilbert (c) sequencing. (d): Fragments generated from either methodology can then be visualized via electrophoresis on a high-resolution polyacrylamide gel: sequences are then inferred by reading ‘up’ the gel, as the shorter DNA fragments migrate fastest.
key features: massive parallel sequencing; short reads (50-200 bp); hundreds of millions–billions of reads per run
👉 The third generation:
Third-generation sequencing technologies, such as the Pacific Biosciences (PacBio) and Oxford Nanopore Technologies (ONT), prioritize read length over read count. Today sequencers can output long reads (typically 10–100 kb) and ultlong reads exceeding 100 kb and extreme cases over 1 Mb.
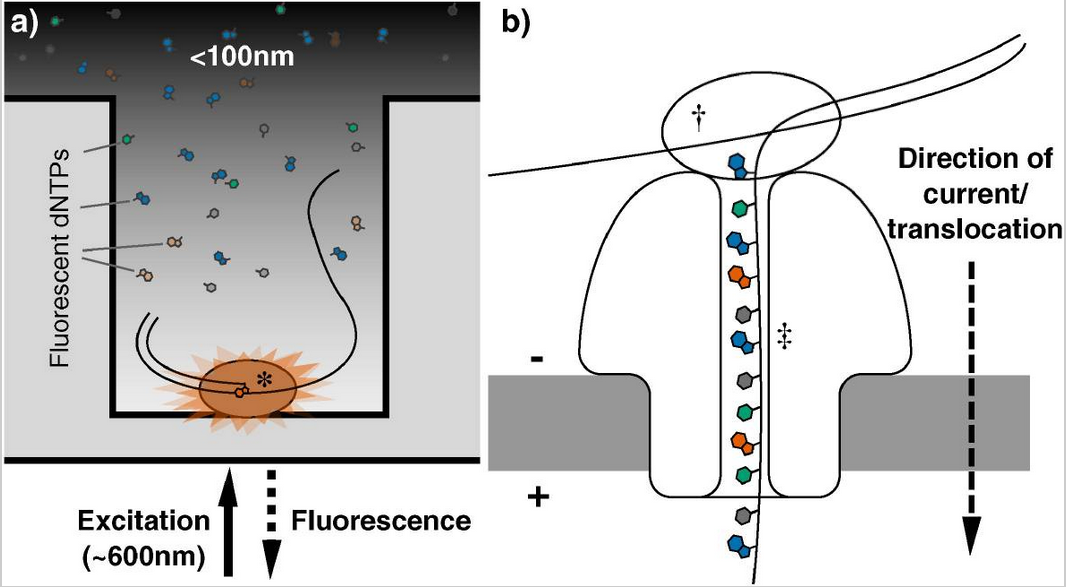
Image credits. Genomics. 2016 Jan;107(1):1–8.. Third-generation DNA sequencing technologies. (a): Nucleotide detection in a zero-mode waveguide (ZMW), as featured in PacBio sequencers. DNA polymerase molecules are attached to the bottom of each ZMW, and target DNA and fluorescent nucleotides are added. As the diameter is narrower than the excitation light's wavelength, illumination rapidly decays travelling up the ZMW: nucleotides being incorporated during polymerisation at the base of the ZMW provide real-time bursts of fluorescent signal, without undue interference from other labelled dNTPs in solution. (b): Nanopore DNA sequencing as employed in ONT's MinION sequencer. Double stranded DNA gets denatured by a processive enzyme which ratchets one of the strands through a biological nanopore embedded in a synthetic membrane, across which a voltage is applied. As the ssDNA passes through the nanopore the different bases prevent ionic flow in a distinctive manner, allowing the sequence of the molecule to be inferred by monitoring the current at each channel.
New possibilities enabled by long-read sequencing
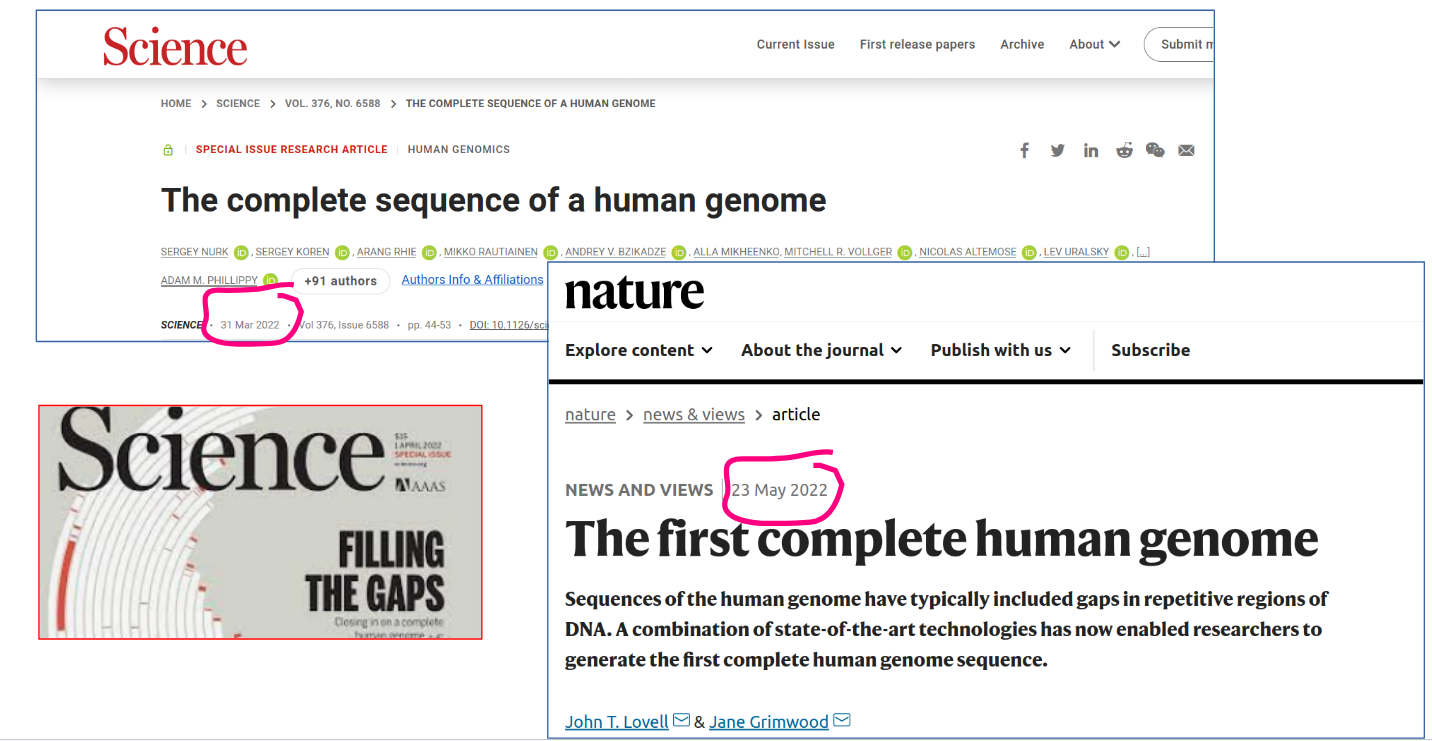
The combined use of two third-generation sequencing technologies—specifically, the PacBio HiFi DNA sequencing method, which can read about 20,000 bases with nearly perfect accuracy, and the Oxford Nanopore DNA sequencing method, which can read up to 1 million bases at a time with more modest accuracy — made it possible to obtain the first complete human genome sequence in March 2022. Thanks to the long reads generated by these technologies, the final 8% of the human genome, consisting primarily of highly repetitive sequences that could not be resolved during the Human Genome Project and were long considered unreachable, has now been completed. In total, nearly 200 million bases were added to the human genome in this effort.
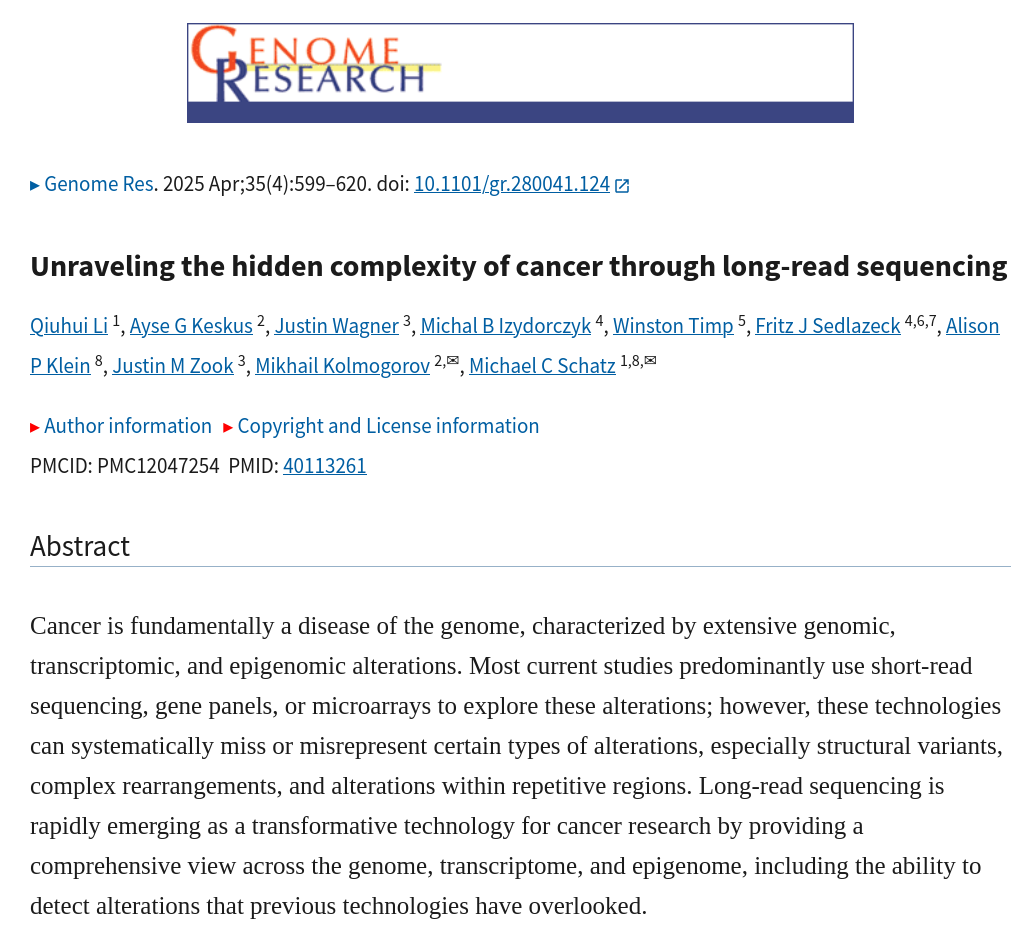
Long-read sequencing has enabled personalized, haplotype-resolved cancer genomics, supporting allele-specific analyses of mutations, including the confirmation of biallelic inactivation, the detection of allele-specific methylation and expression, and the resolution of complex structural variants.
key features: direct sequencing (no amplification); long reads (up to 30.000 bp)
The sequencing-by-synthesis approach
Sequencing-by-synthesis (SBS) is the primary approach used by next-generation sequencing (NGS) technologies, particularly methods like Illumina Sequencing (Bridge Amplification) or Roche 454 (Emulsion PCR), to identify incorporated nucleotides. These systems involve immobilizing fragmented DNA, generating clonal clusters to amplify the signal, and detecting base incorporation via fluorescence or light.
❓ A question for you: Can Sanger sequencing be classified as sequencing-by-synthesis (SBS)? Why or why not?
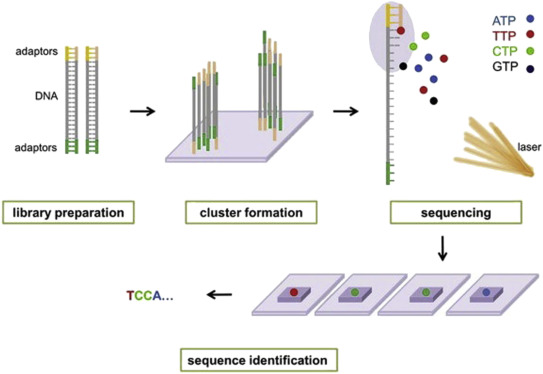
Key steps:
- Attach to Something (Immobilization): DNA fragments are attached to a solid support, such as a flow cell (Illumina) or beads (454/Ion Torrent).
- Amplify Signal (Signal Amplification): To make the signal detectable, single molecules are amplified into local clusters of identical copies.
- Bridge Amplification: Commonly used by Illumina to generate dense clusters on a solid surface.
- Emulsion PCR (ePCR): Used by 454 to amplify DNA on bead surfaces.
- Couple Sequencing (System to Reveal Nucleotide):
- Illumina/Solexa: A DNA polymerase incorporates fluorescently labeled, chain-terminating nucleotides. Each incorporation event is imaged to identify the nucleotide.
- 454/Roche (Pyrosequencing): Employs luciferase to detect light produced when a nucleotide is added to the growing strand (454).
- Ion Torrent: Measures the pH change (H+ release) during nucleotide incorporation.
🎥 Short video illustrating the Illumina sequencing technology
NGS Data Analysis Workflow
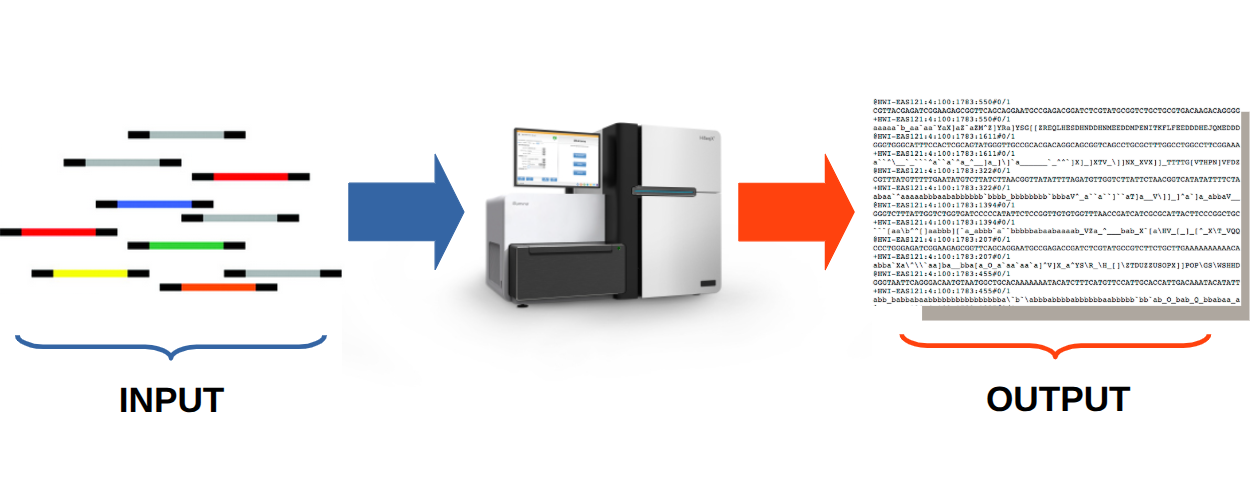
NGS input and output may appear similar, but analysis and interpretation depend on the type of fragments and the biological questions.
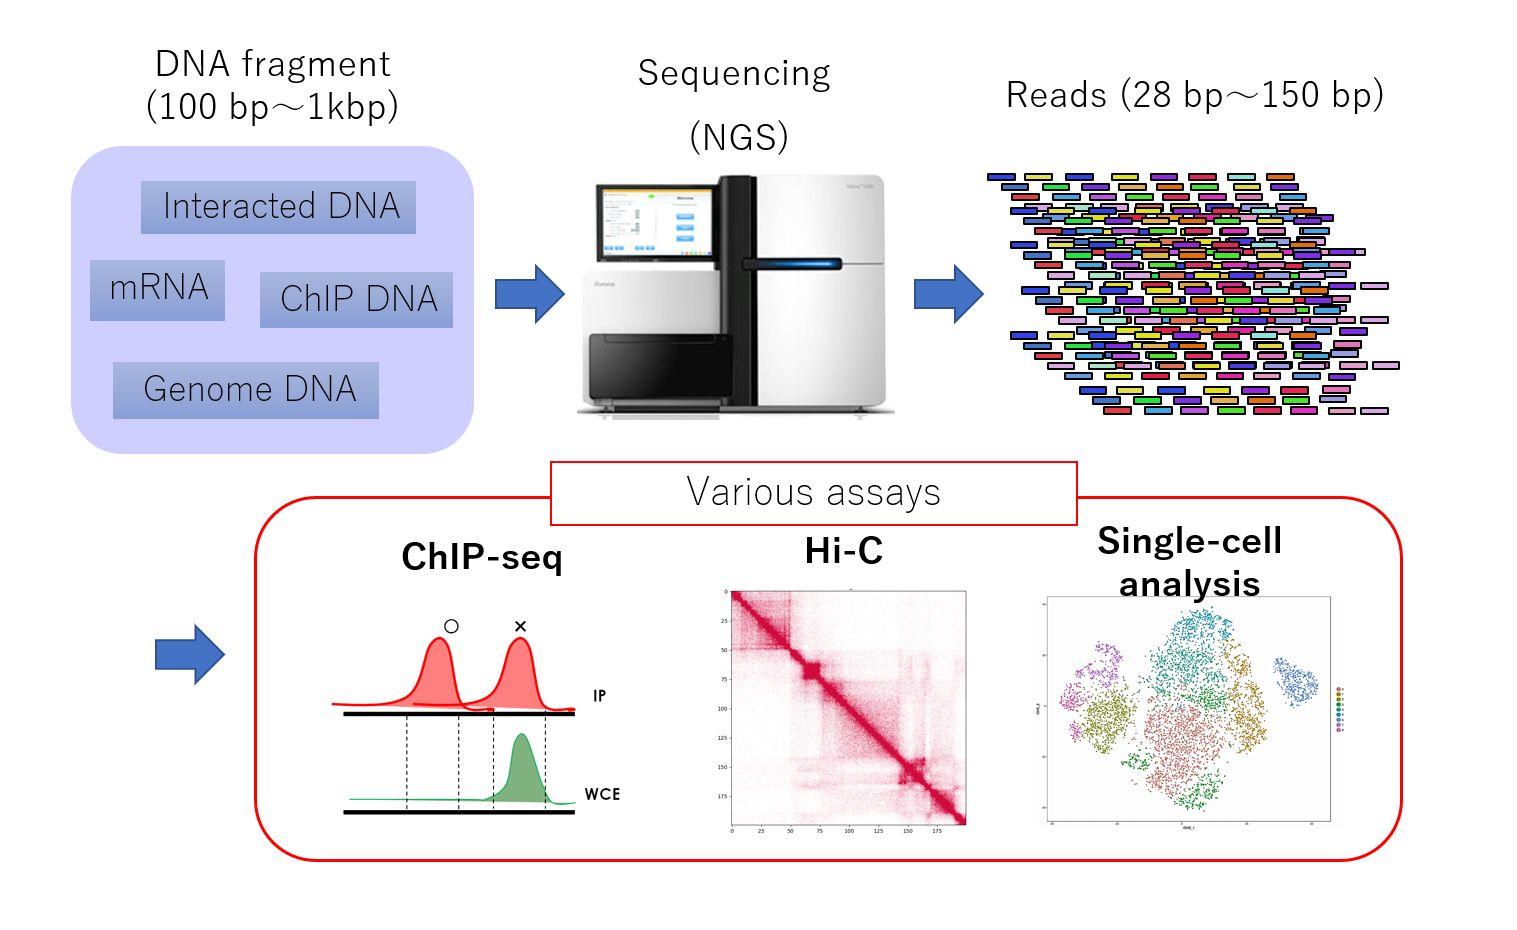
Typical steps in NGS data analysis:
- Data preprocessing – Quality control, trimming low-quality reads, and filtering contaminants to prepare clean data.
- Statistical analysis – Identifying significant patterns, such as differential expression, variant calling, or enrichment analysis.
- Result visualization – Creating graphs, heatmaps, or other plots to summarize and explore the data.
- Result interpretation – Drawing biological conclusions, integrating findings with prior knowledge, and generating hypotheses.
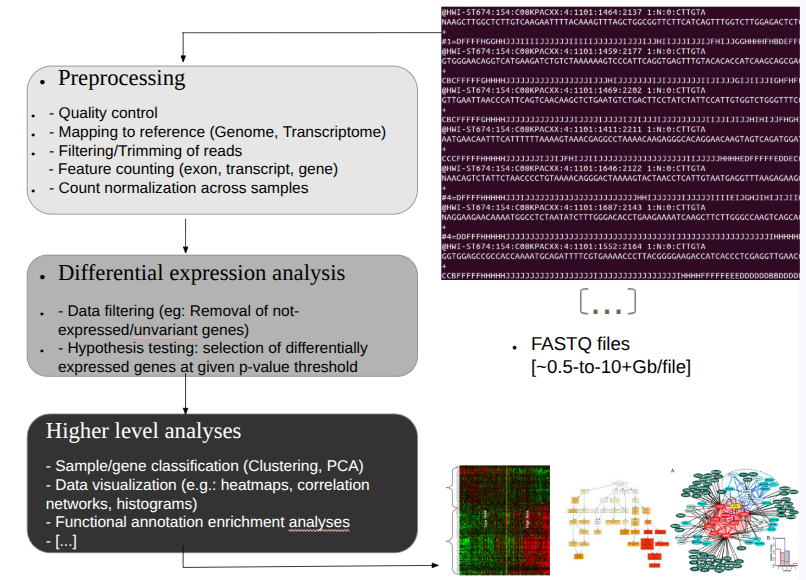 RNA-seq data analysis workflow: typical steps from raw reads to biological interpretation.
Further insights
Quality of sequencing reads: the Phred score
A Phred score (Q score) is a numerical measure of base-calling quality in a sequencing read. It represents the probability that a base call is incorrect on a logarithmic scale, as defined by the following formula:
Q = -10 log₁₀(P), where P represents the probability of an incorrect base call.
For instance: a score of Q20 indicates a 1% error rate (99% accuracy), while Q30 indicates a 0.1% error rate (99.9% accuracy).
Higher scores indicate greater confidence in the base call. Q30 is generally considered the standard for high-quality.
Scale: Scores typically range from 0 to 60+.
- Q10: 1 in 10 error rate (90% accuracy).
- Q20: 1 in 100 error rate (99% accuracy).
- Q30: 1 in 1,000 error rate (99.9% accuracy).
- Q40: 1 in 10,000 error rate (99.99% accuracy).
Commonly Used Thresholds:
- less than 20: Poor quality
- between 20 and 28: Reasonable quality
- over 28: Good quality
From Phred score to accuracy
Given a Phred score, you can calculate the following:
- the probability (P) that a base call is incorrect, given by:
P = 10^{-Q/10}
- the accuracy of the base call for a given nucleotide
base call accuracy = 1 - P
Example: A sequencing read has a Phred quality score (Q) of 30 at a given base.
- What is the probability (P) that this base call is incorrect? Q=30 –> P = 10^(-30/10) = 0.001, i.e., 1 in 1,000 error rate.
- What is the corresponding accuracy (i.e., probability that the base call is correct)? Accuracy = 1 - P = 1 - 0.001 = 0.999, i.e., 99.9% accuracy.
❓ A challenge for you: Complete the first point (Inspect a raw sequence file) in this Galaxy tutorial on Quality control Note: you do not need to use Galaxy to perform this step.
❓ A question for you: By examining the full list of ASCII symbols, can you guess why the characters used for quality encoding start at ASCII code 33?
❓ A challenge for you: A sequencing read has a Phred quality score (Q) of 14 at a given base.
What is the probability (P) that this base call is incorrect? What is the corresponding accuracy (i.e., probability that the base call is correct)?
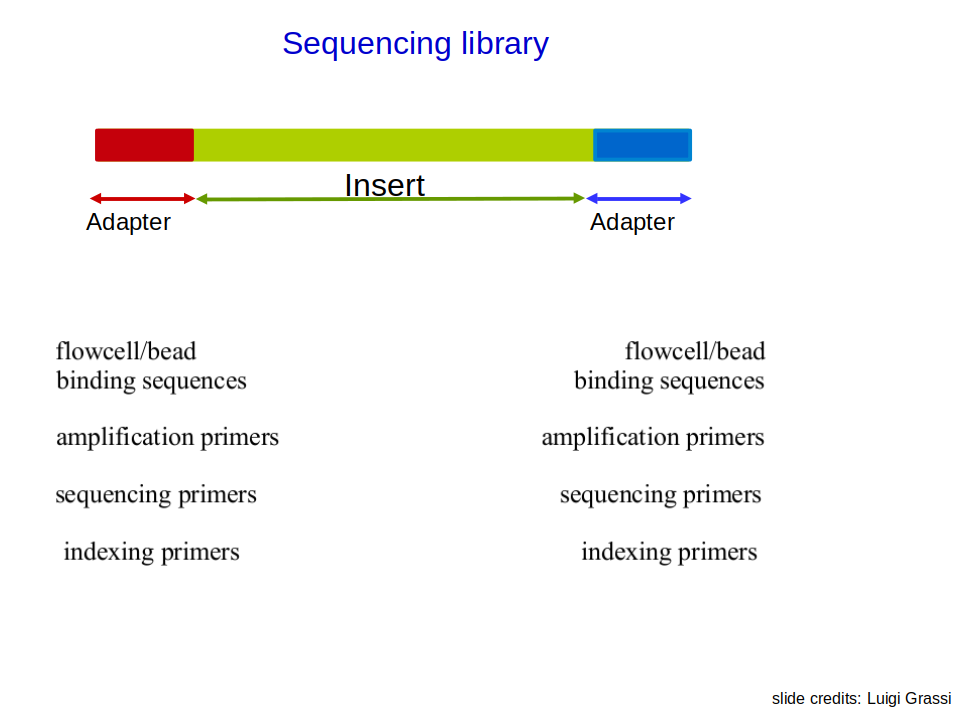
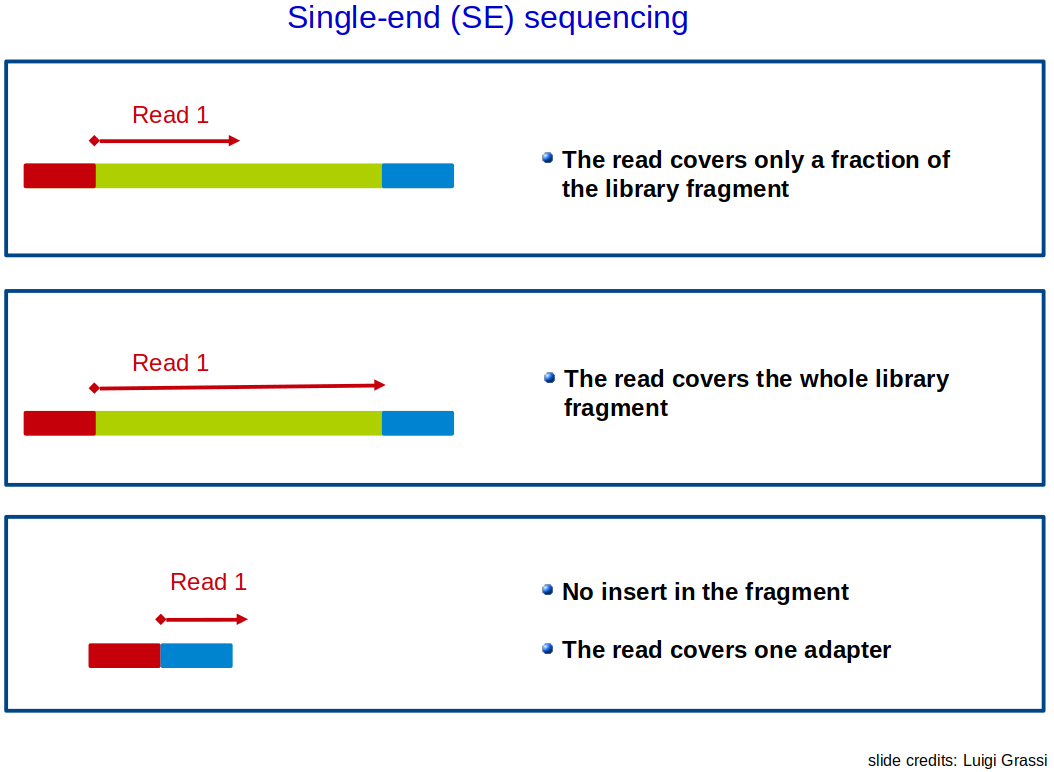
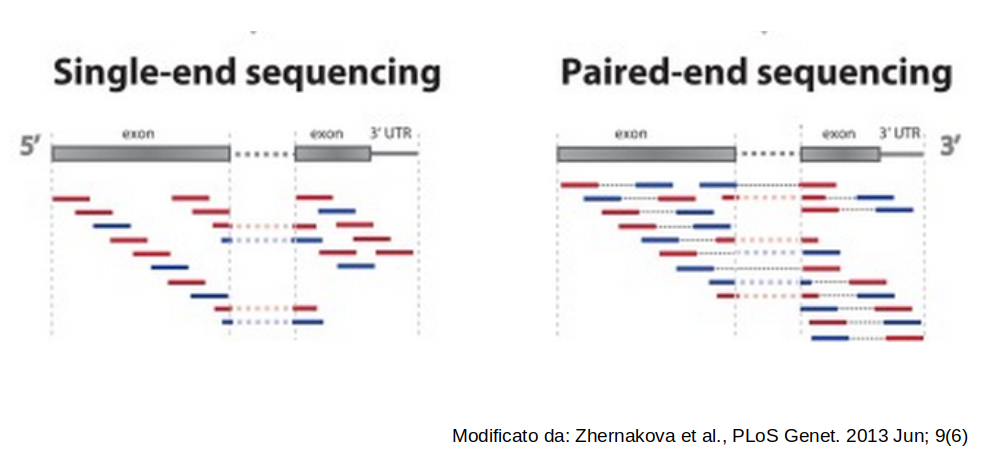
Single-end vs Paired-end sequencing: Overview
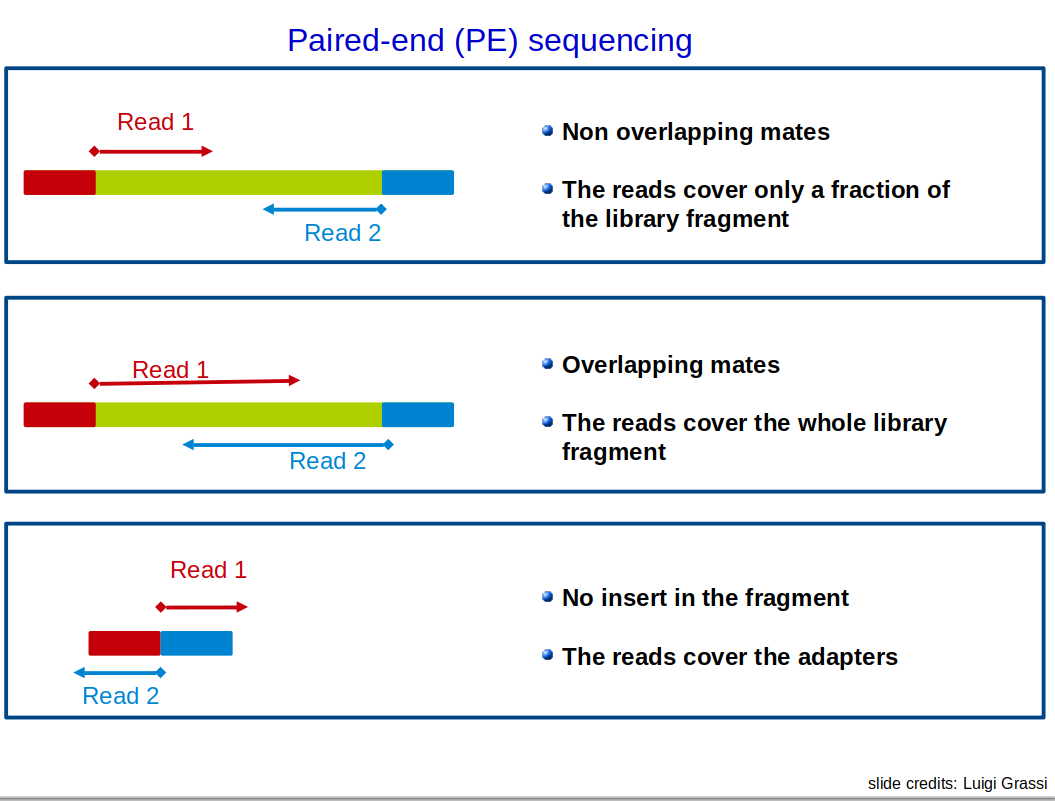
❓ A question for you: Mature microRNAs are typically 17–22 nucleotides long. A lab wants to study their expression using NGS. Which of the following sequencing strategies would you recommend, and why?
a. Single-cell sequencing, 50 bp read length (minimum sequencing length) b. Paired-end sequencing, 50 bp read length (minimum sequencing length) c. Paired-end sequencing, 150 bp read length
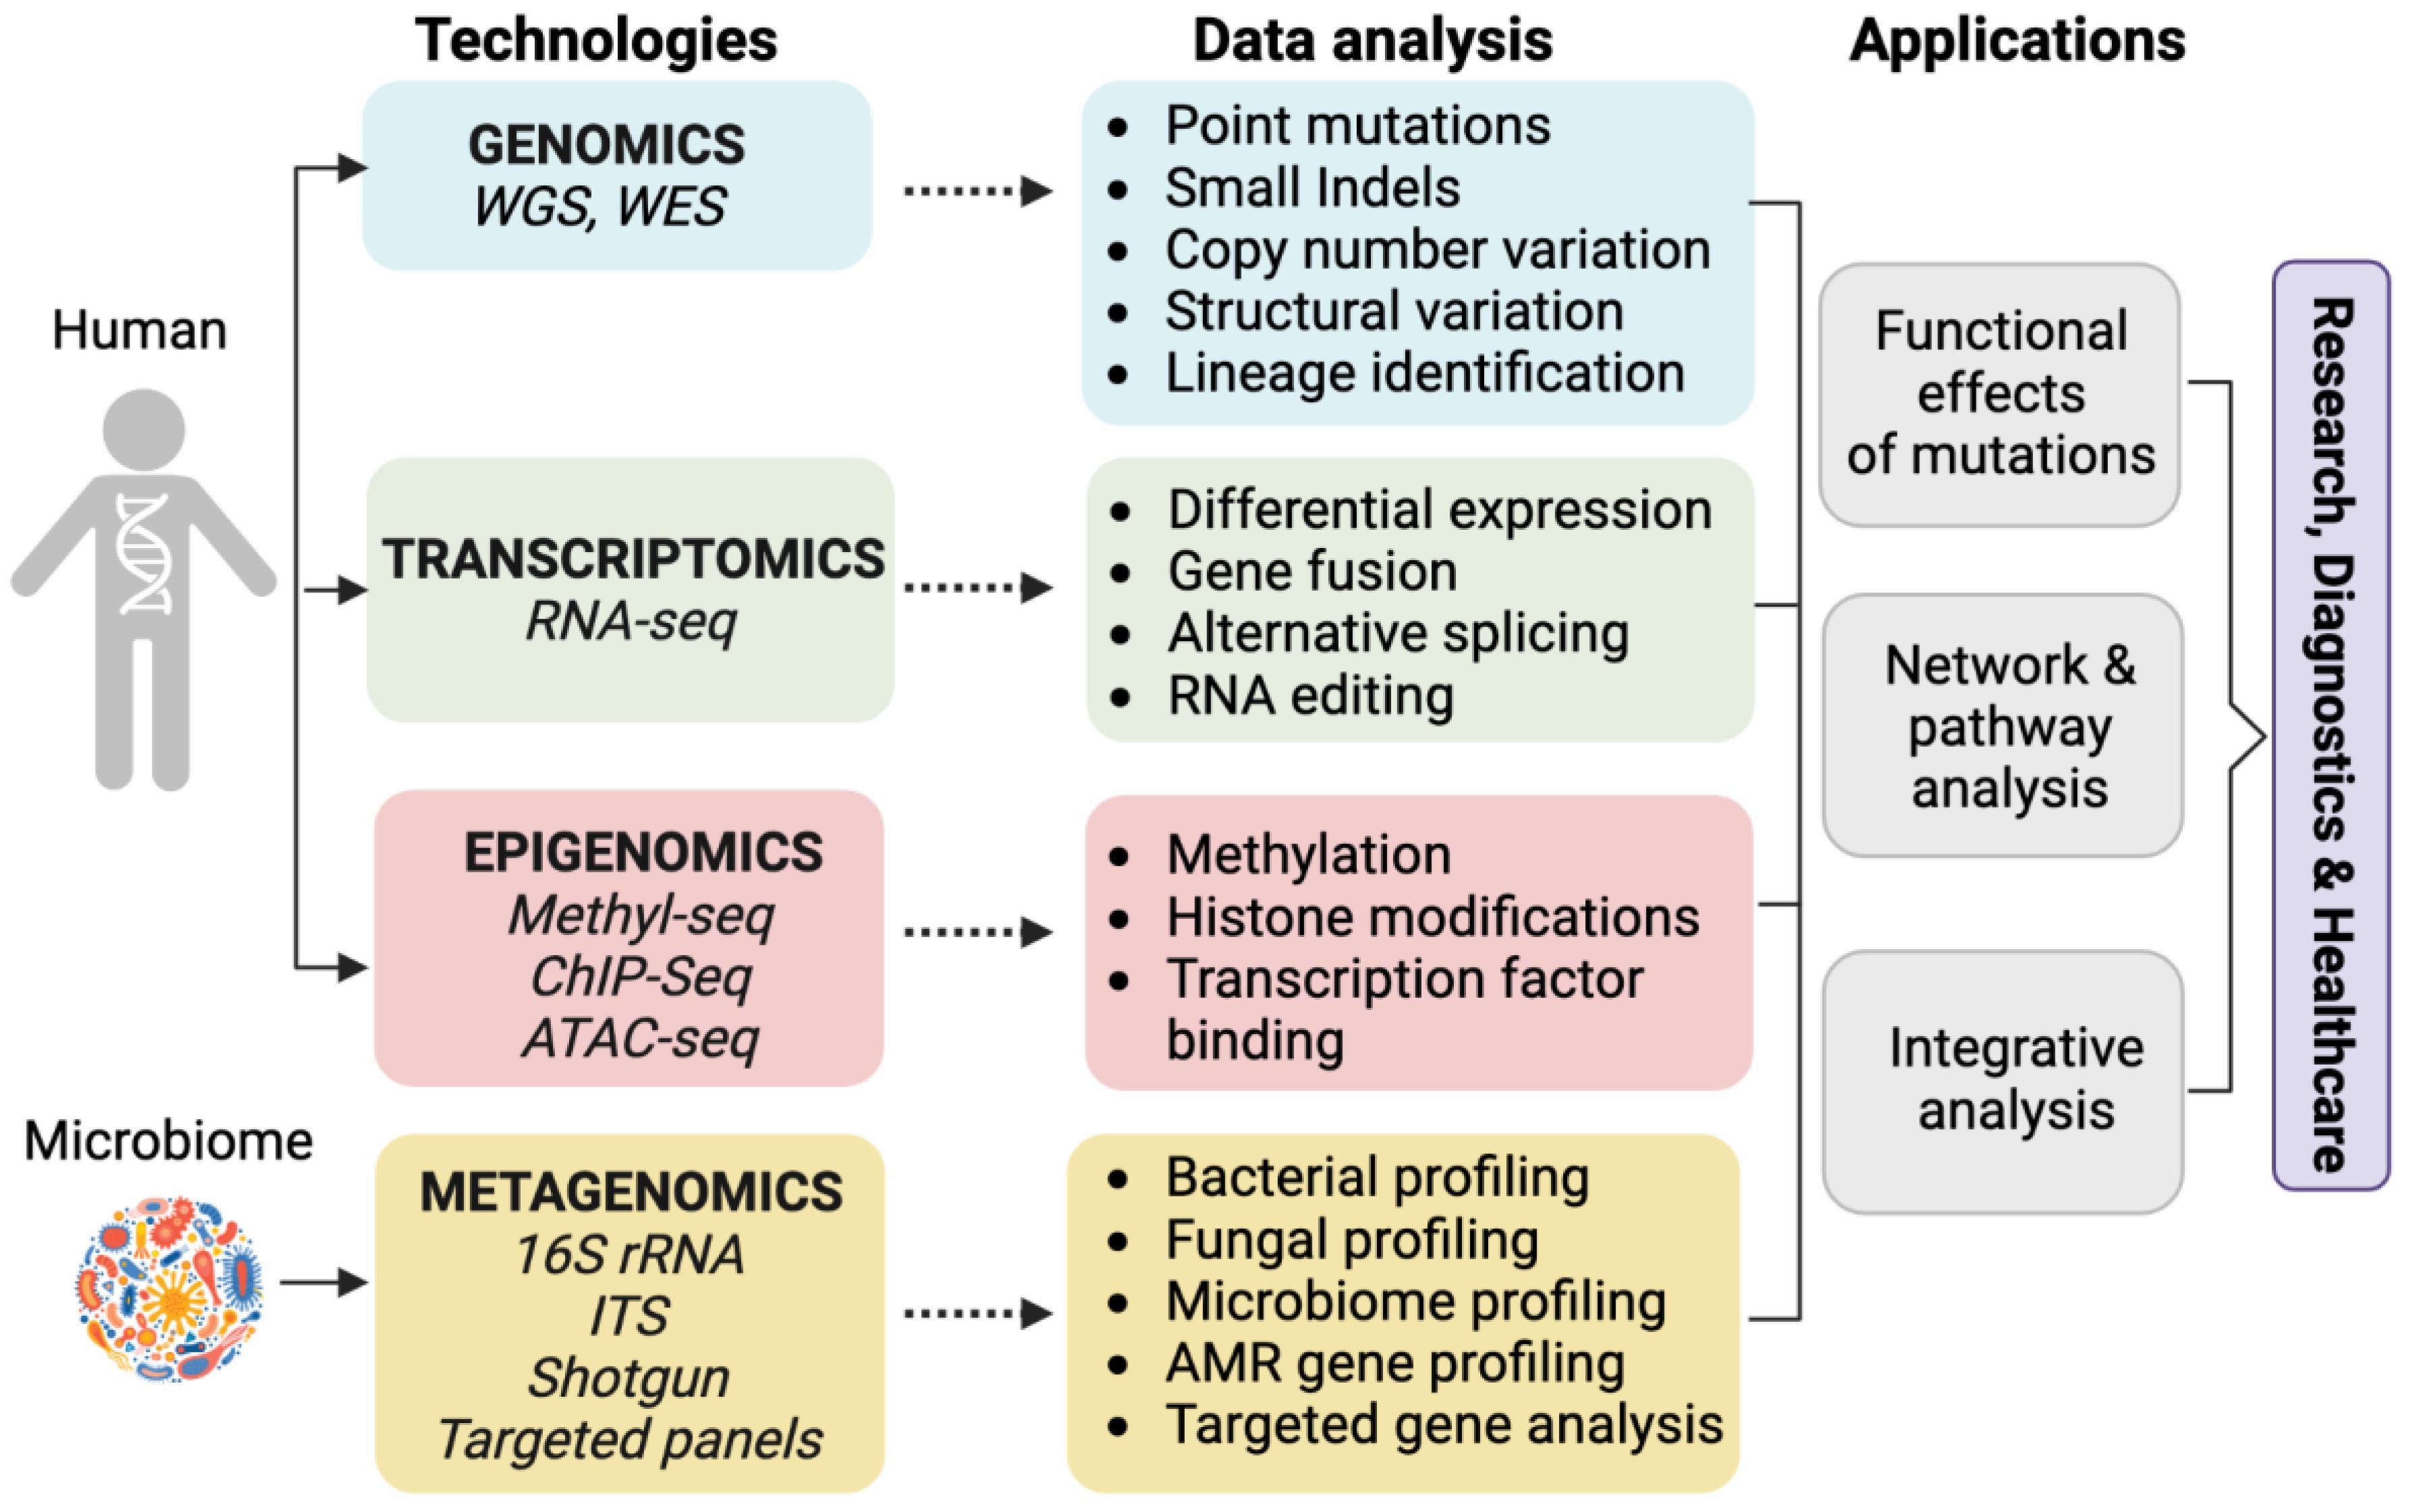
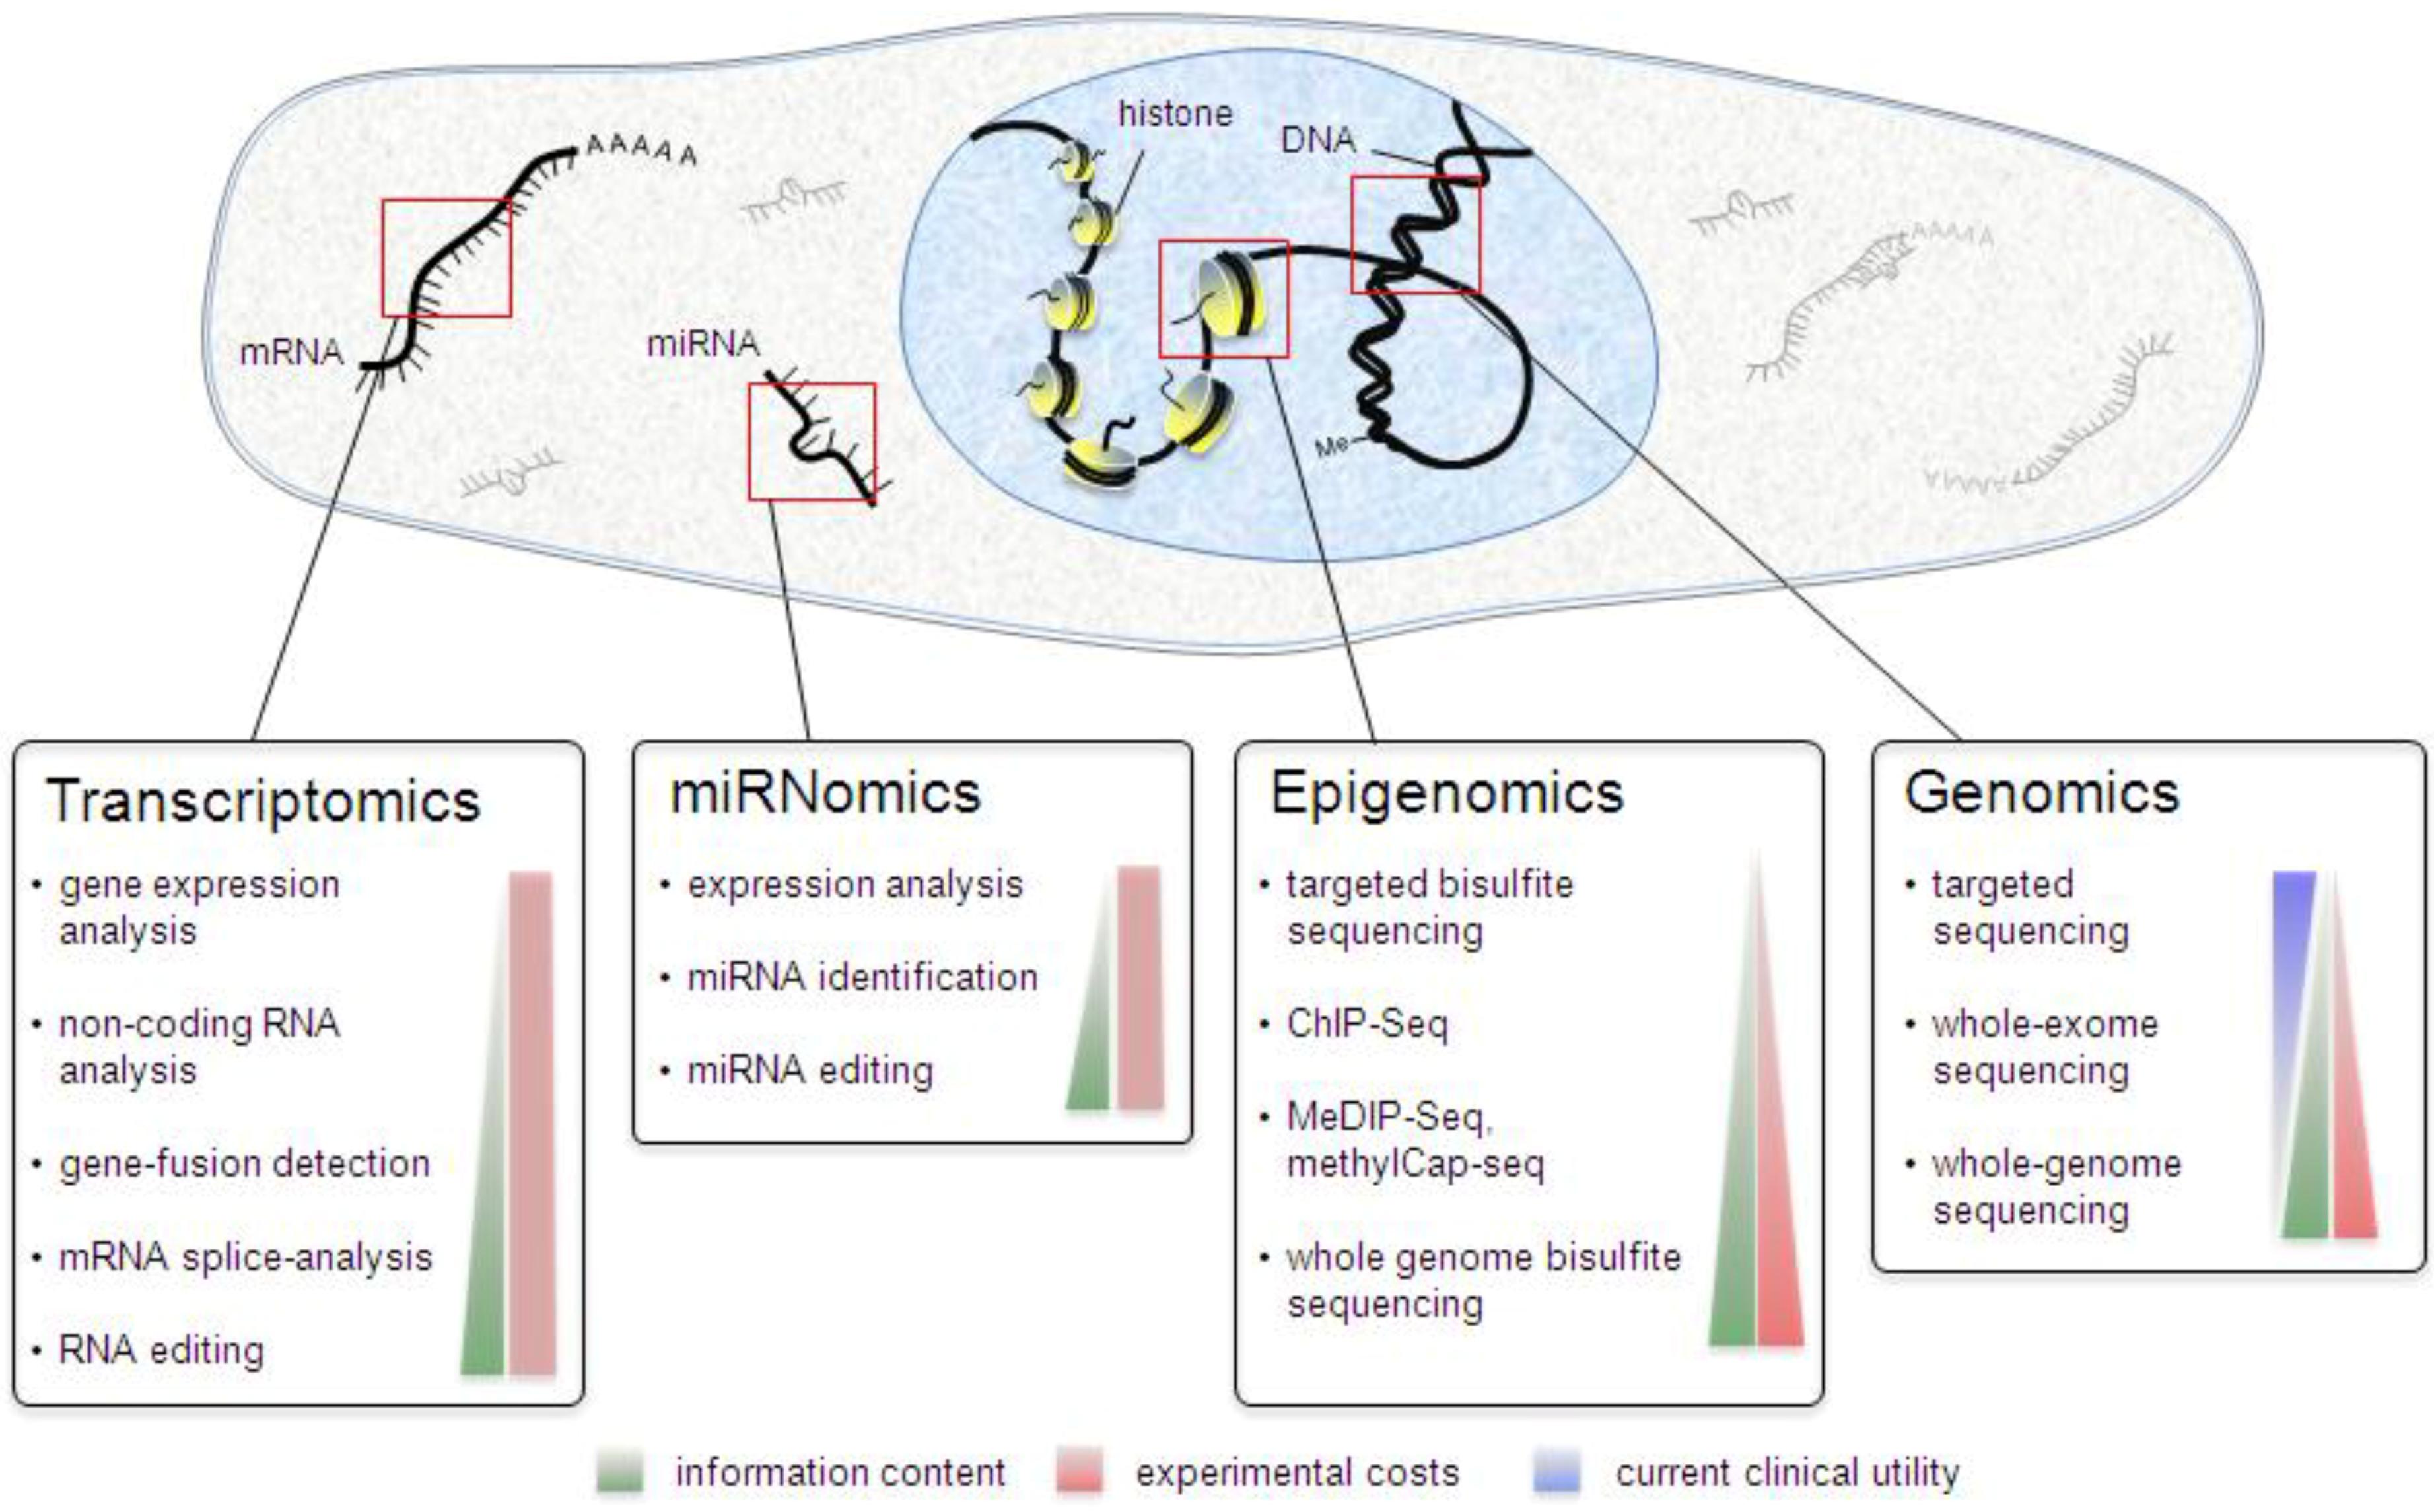
Different Types of Omics Data
The term omics refers to large-scale, comprehensive datasets that profile entire classes of biological molecules simultaneously. With the advent of high-throughput genomics (HTG) technologies, data production and analysis shifted from studying one gene or transcript at a time to measuring all genes or transcripts at once. This shift is reflected in the -omics suffix, which now spans numerous fields—from genomics and transcriptomics to proteomics, metabolomics, and beyond—enabling a holistic view of biological systems.
References and resources
- A couple of reviews on first-, second-, and third-generation sequencing technologies:
– The sequence of sequencers: The history of sequencing DNA. Genomics. 2016 Jan;107(1):1-8. doi: 10.1016/j.ygeno.2015.11.003. Epub 2015 Nov 10. PMID: 26554401; PMCID: PMC4727787.
– Slatko BE, Gardner AF, Ausubel FM. Overview of Next-Generation Sequencing Technologies. Curr Protoc Mol Biol. 2018 Apr;122(1):e59. doi: 10.1002/cpmb.59. PMID: 29851291; PMCID: PMC6020069.
– Reuter JA, Spacek DV, Snyder MP. High-throughput sequencing technologies. Mol Cell. 2015 May 21;58(4):586-97. doi: 10.1016/j.molcel.2015.05.004. PMID: 26000844; PMCID: PMC4494749. - NHGRI resource on the evolution of human genome sequencing costs https://www.genome.gov/about-genomics/fact-sheets/Sequencing-Human-Genome-cost
- RNA-Seq Data Analysis in Galaxy: Batut B, van den Beek M, Doyle MA, Soranzo N., Methods Mol Biol. 2021;2284:367-392. doi: 10.1007/978-1-0716-1307-8_20. PMID: 33835453.
- Galaxy Project video documentation and training resources: official YouTube channel for the Galaxy Project